Monitor specsheets can tell you basic characteristics of a display, but not how it fully performs. In-depth reviews include some form of GtG response time and color accuracy testing.
In-depth reviews
Some in-depth reviewers, in subjective order of best first:
- Monitors Unboxed
- Rtings with Test Bench 2.0
- Focus on data, scores can be arbitrary and weights nonsensical
- 小雪人评测
- 好屏如潮
- TFTCentral + YouTube
- Techless
- TechteamGB + YouTube
- KitGuru
- TotallydubbedHD
- Stilgar from moreleTV
- Aperture Grille + YouTube
- PC monitors + YouTube
- io-tech
Some useful information (Spyder, OSRTT, etc.):
- optimumtech
- LDAT VESA style response time measurement is not very useful
- GTID
- OSRTT but no RGB tolerance specified, TestUFO with gray backgrounds
- 颠佬评测
- Calman Ultimate for color accuracy but unclear response time methodology and cropped TestUFO vertical lines
- 数玩工场 / inteceh Digit Workshop
- Spyder measurements
Response time
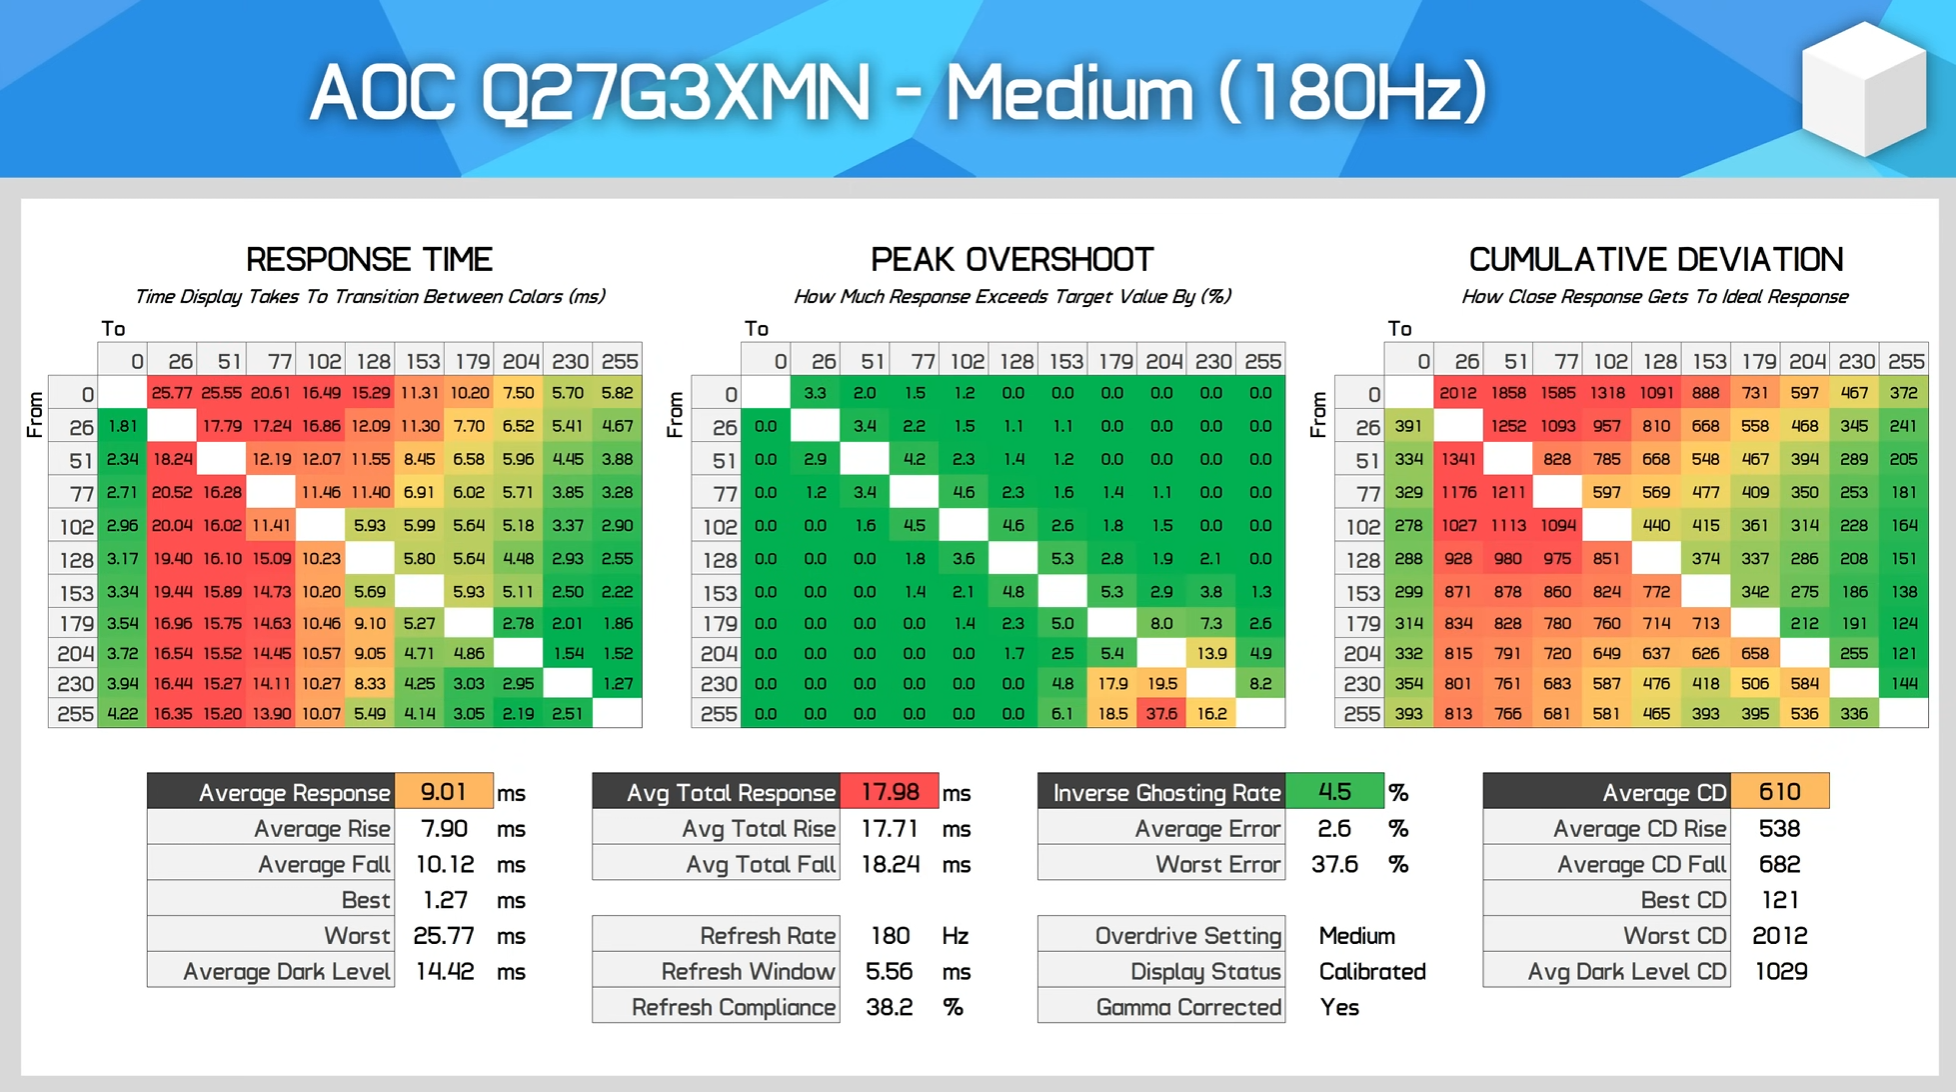
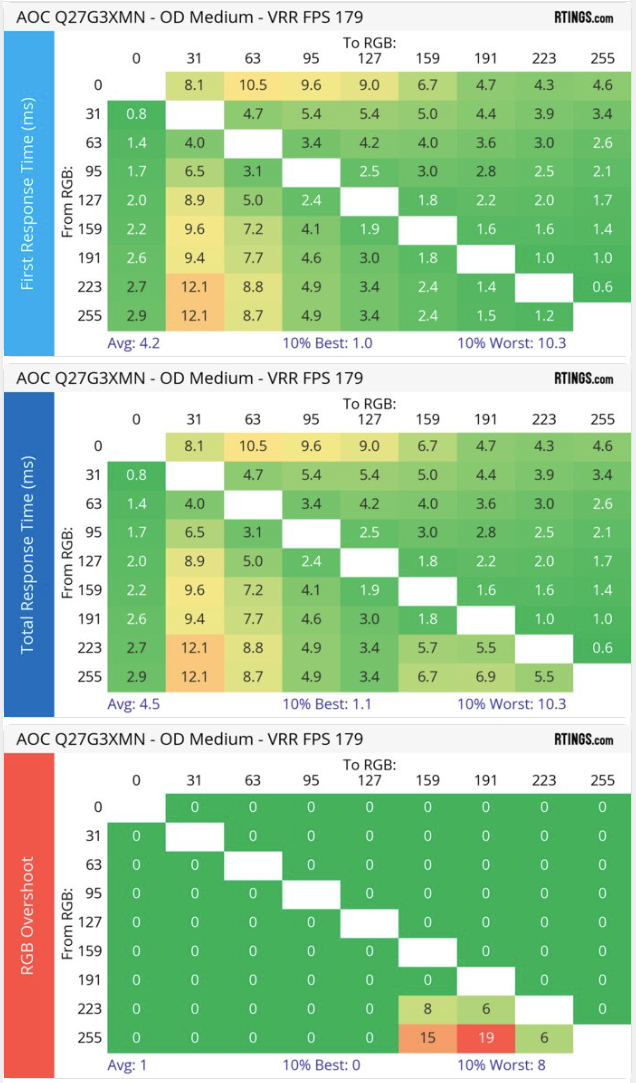
Advertised 1 ms LCD response time is never real. On (LCD) monitors, pixels are typically made up of 3 subpixels for the red, green and blue channels where all of these subpixels are internally just gray with a color filter on top. Gray-to-gray (GtG) response time refers to how long it takes for a (sub)pixel to change from one shade of gray to another, 0% being black and 100% being white. This controls the shade of each primary color for a pixel. On LCDs, response time isn’t uniform and depends on the starting shade and target shade for each (sub)pixel. Response time testing usually includes going through some test patterns of different gray values and forming a heatmap of how long a transition takes. Response times longer than the refresh interval of a display will cause trails on moving objects (ghosting) or visible artifacts when missing the target shade with over/undershoot from aggressive overdrive.
VESA specification is to measure the total response time from some starting luminosity and target luminosity, and then discard the first and last 10%, meaning 10-90% of the total luminosity change is the transition. However, you’ll notice most reviews don’t use percentages but 0 for black and 255 for white (8-bit color allows for 256 distinct shades), typically due to the use of gamma correction as eyes don’t perceive shades from black to white linearly and can tell differences in darker shades better than light ones. OSRTT is the industry-standard measurement tool, but others may include LDAT or custom photodiode-based tools. Different reviewers may have different configurations for any, such as use of gamma correction or tolerances (e.g. measurement concludes when value +- 3-10 shades from target). Thus, the numbers from different reviewers often aren’t directly comparable.
For in-depth information on this topic, see the following:
- Aperture Grille: How LCD Response Times are Measured, and Why 10% to 90% GtG Measurements are Moderately Deceptive
- TFTCentral: Response Time Testing – Pitfalls, Improvements and Updating Our Methodology
- Blur Busters: GtG versus MPRT: Frequently Asked Questions About Pixel Response On Displays
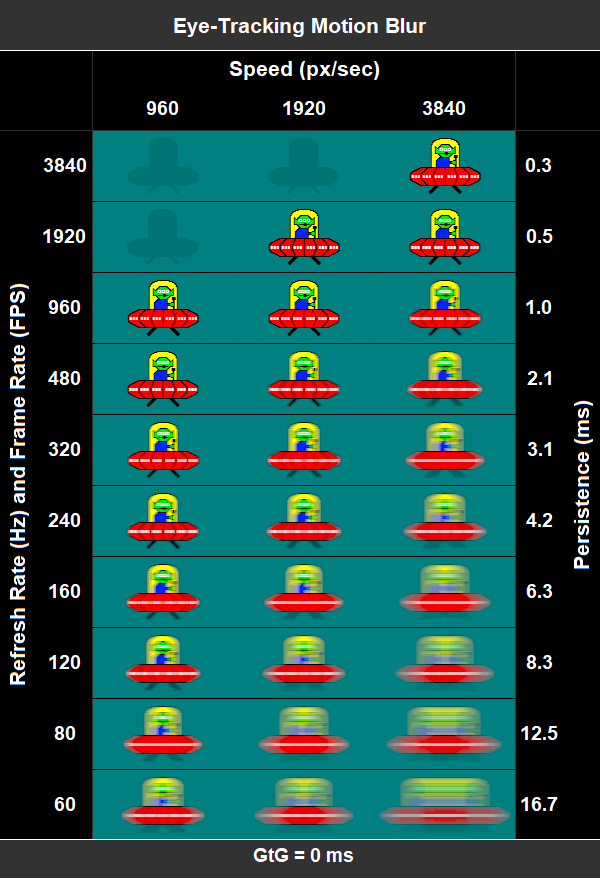
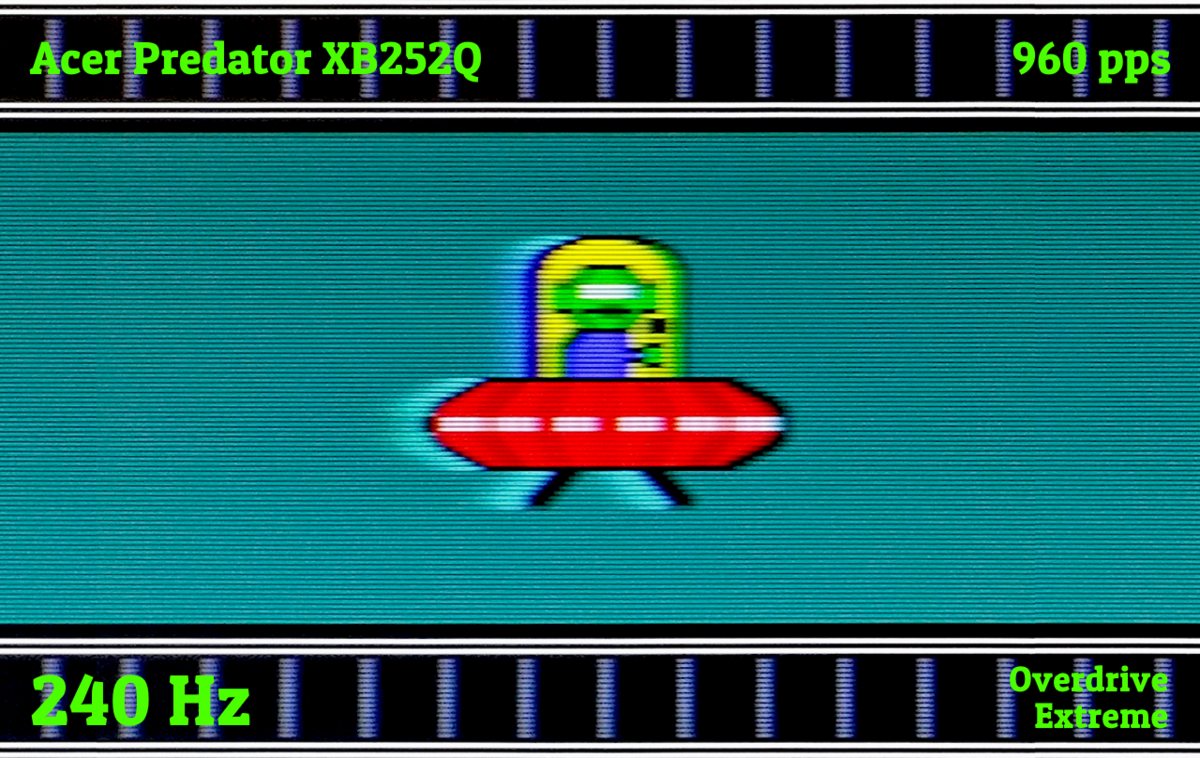
Other motion clarity tools include panning images (pursuit photos) such as TestUFO, Smooth Frog and Rtings Test Bench 2.0 Pursuit, which aim to provide a “what you see is what you get” picture of GtG-related ghosting and refresh rate related moving picture response time (MPRT). These have separate indicators for whether the pursuit photo was taken properly (dots form vertical lines), but many reviewers crop this out in their photos.
For in-depth information on this topic, see the following:
- Blur Busters: HOWTO: Pursuit Camera With Motion Tests
- Aperture Grille: Smooth Frog: An Updated Version of Frog Pursuit
- Rtings: How Our New Pursuit Pattern Makes Comparing Monitors Easier
Color accuracy
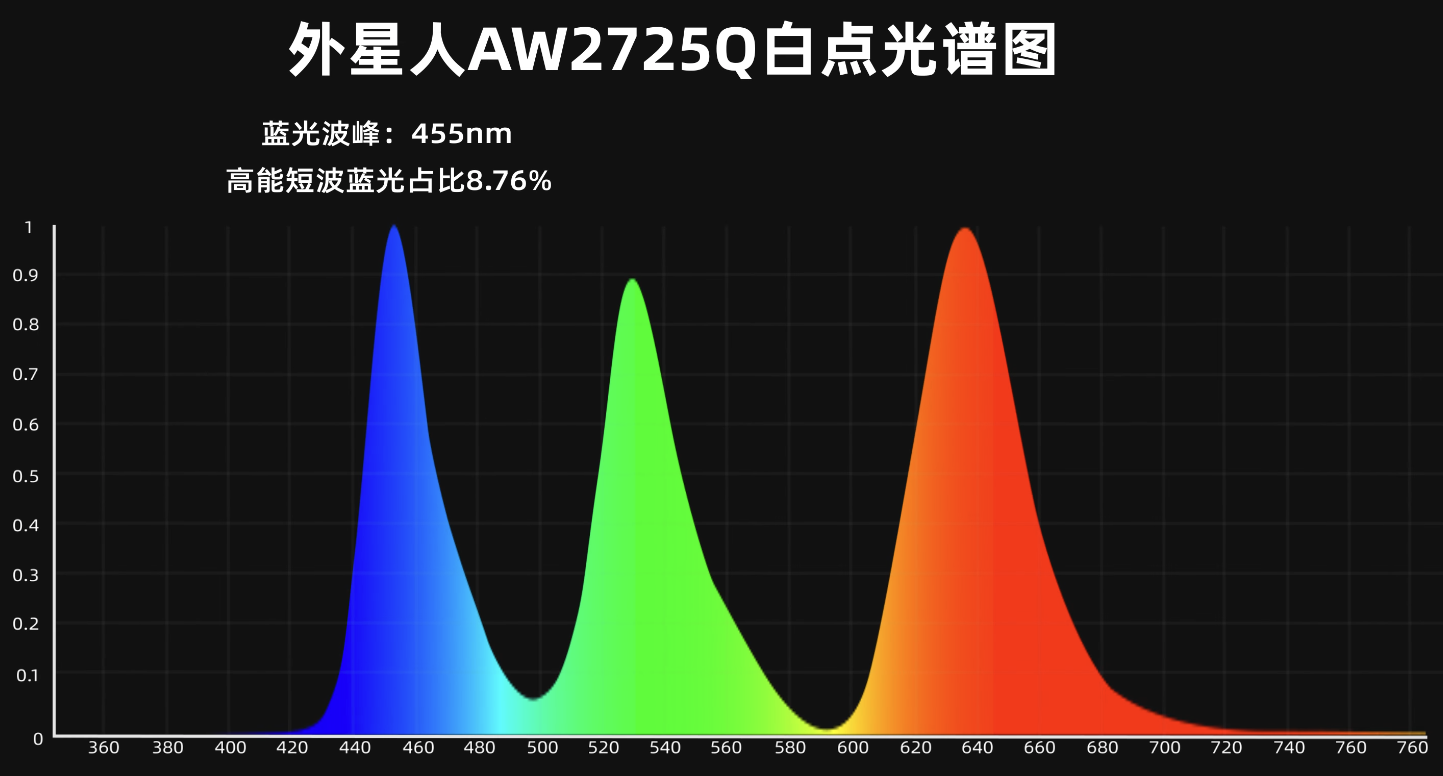
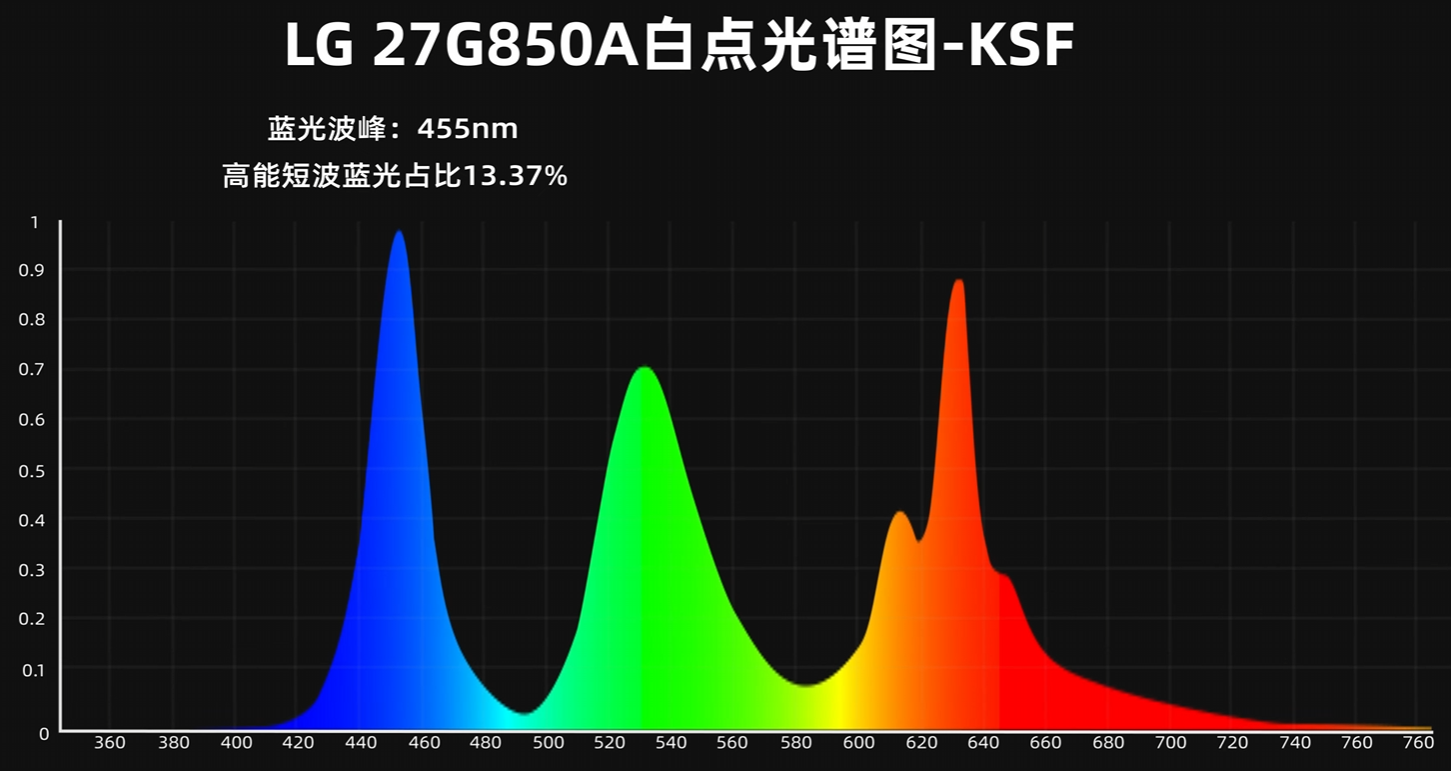
Most internet content is mastered to an old color standard called sRGB. However, many gaming monitors are much wider gamut, often around 95%+ DCI-P3 which ends up oversaturated for sRGB content. This is technically not accurate, but might still be preferred as sRGB covers a relatively small amount of the visible spectrum. Basically all gaming monitor reviews use consumer or prosumer grade colorimeters (e.g. Calibrite, Spyder) to measure adherence to some color gamut (sRGB, DCI-P3, Rec.2020), color temperature / white point and EOTF (electro-optical transfer function, also known as a tone reproduction curve, TRC, or gamma). However, much of the whitepoint depends on spectral power density emitted by the display which varies between panels.
Colorimeters include generic spectral correction profiles which may not match the measured monitor. Custom spectral corrections can be created using a spectrometer and most models can be found on the DisplayCAL Color Corrections database. However, Spyder models don’t support loading external spectral corrections making them far less accurate compared to a separately profiled colorimeter. Furthermore, they have worse low light accuracy compared to most (i1D3-based) Calibrite/X-Rite/ColorMunki probes, making contrast measurements questionable.
A general rule of thumb is to prioritize white point accuracy and gamma curve (either 2.2 or piecewise sRGB) while gamut / oversaturation is more of a matter of taste.
(WIP - sRGB piecewise vs flat 2.2 gamma, adding links for further reading on display color theory)
Further reading:
- Andrew Rodney: The color of white
- Eaglshadow: Creator’s intent is a little bit broken when it comes to SDR gaming
- ArgyllCMS Documentation: Topical Discussions
- MHC2